


Features of the PPT Template:
Data Analytics-Focused Design:
- Perfect for illustrating analytics tools, business growth strategies, and insights achieved through data.
- Applicable for educators, data scientists, and business analysts.
- No restrictions when it comes to using Microsoft Powerpoint, Google Slides or Keynote.
- Editable slides where you can change the text, colors, icons and even charts.
- The color scheme embodies elegance with a Dark Blue-Grey Background along with Red and Orange Accents energizing the theme.
- Graph depicting growth image on the cover for a startlingly captivating and relevant look at a glance.
- Title slide, tools and techniques overview, business insights, growth strategies and others.
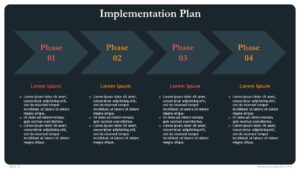
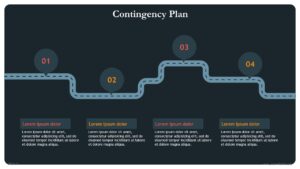
- Diagrams, charts and branched infographics for a clear and orderly display.
- Designed for 16:9 aspect ratio, perfect for modern displays and projectors.
Where the PPT Can Be Used:
- Business Presentations: Data insights and growth strategies to stakeholders.
- Data Analytics Workshops: Teaching about data analytics tools and techniques.
- Corporate Meetings: Sharing business insights alongside analytics with the teams.
- Educational Seminars: Teaching about the role of data analytics as a core tool in businesses.
- Online Learning: Designing captivating presentations for data analytics sessions.
How to Use the Template:
- Download: Get the template file in either PPTX or Google Slides formats.
- Customize: Edit the text, modify the color scheme, and change the placeholders to suit your business's branding.
- Add Content: Provide the details of the project, data, and visuals pertaining to the project.
- Present: Use for live presentations or virtual meetings, or export for use as a PDF file.
Who Can Use This Template:
- Business Analysts: To showcase techniques and strategies to various data driven insights.
- Data Scientists: To present analytics tools and techniques.
- Educators: To discuss data analytics in the context of modern day businesses.
- Corporate Trainers: For analytics teaching sessions with teams.
- Students: For data analytics projects or other assignments.
Purpose of the Template:
- To guarantee effective communication and strong impact while explaining data analytical topics.
- To foster a professionally engaging, aesthetically appealing, lay-outing, and easy to use presentation for data analytics projects.
- To ensure that the user does not spend time and effort in designing a presentation from ground zero.
Color Scheme & Design Elements:
- Primary Colors: Dark Blue-Grey (sophistication, professionalism), Red (urgency, energy), and Orange (creativity, optimism).
- Background: Professional look Clean and modern design.
- Icons & Graphics: Professional data analytics themed visuals to support concepts.
- Aspect Ratio: Professional and modern 16:9 widescreen resolution.
Free Business with Data Analytics Presentation
The Free Business with Data Analytics PowerPoint Presentation Template has created professionally and is versatile as well as easy to use. This template helps to create captivating and informative presentations relevant to Data Analytics and Data Analytics in the business world.The template has a cover image of a graph along with dark blue-grey background with red and orange accents. This template not only looks very sophisticated, but also full of energy and highly professional making it apt for business analysts and data scientists. With the help of thistemplate, data-driven insights can easily be showcased with the use of modern tools that helps to present analytics along with explaining the growth achieved through different ways of data analytics. The template is compatible with Microsoft PowerPoint, Google Slides and Keynote which makes it all the more easy and convenient. Fully designed slides are also incorporated to ensure a seamless presentation experience.